Satellite Interferometry, InSAR
ECI utilizes an open source software package, GMTSAR, to process raw Synthetic Aperture Radar (SAR) images into interferometric SAR images (InSAR) which can be used to measure surface deformation related to earthquakes, landslides, mining and extraction of water, oil and gas. Multiple sets of InSAR images can also be stacked using an SBAS time-series processor to filter out the interference caused by moisture in the atmosphere and by ionospheric interference. This allows us to create models of surface deformation rates down to the order of millimeters per year. Multiple products can be created with the software in addition to the InSAR images. Images representing the coherence, or how well the two satellite images fit together is produced as a byproduct and can be used to map areas where the deformation is too great or too chaotic to be represented as an interferogram. This allows us to map surface ruptures of faults, landslides and liquefaction, covering large areas with one single set of radar images.
ECI staff is part of the development team behind GMTSAR, and as such has the ability to add or change features of the software in addition to correcting programming errors.
InSAR Products
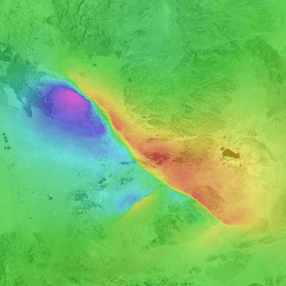
Case Study – 2019 Ridgecrest Earthquakes
Ridgecrest 2019 Earthquake
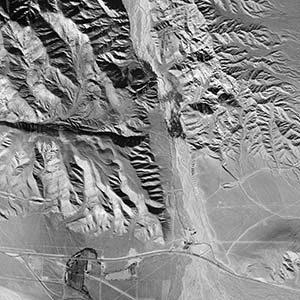
US National Map Imagery (1ft or better)
Ridgecrest 2019 Earthquake
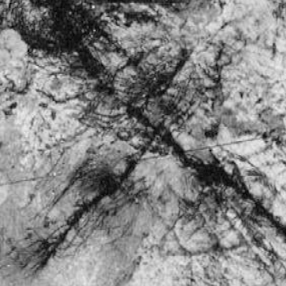
SAR Correlation map
Ridgecrest 2019 Earthquake
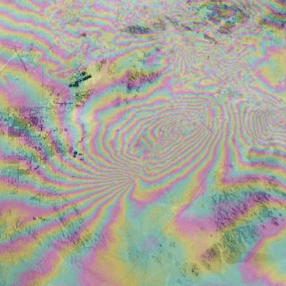
Wrapped interferogram, 55.4 mm (2.18″) per color cycle
Ridgecrest 2019 Earthquake